In this post,
We will load the data from the csv file from given URL and then do some basic processing and then display the extracted parameters from the data. and plot the data graph.
Programming Language: Python 3
Software: Anaconda Jupyter Notebook
Here, csv file contains temperature data and the format of the csv file is as follows:
Run the following code in Anaconda Jupyter Notebook.
code block and its expected output are shown below:
Code In[1]:# coding: utf-8
# In[1]:
## EXAMPLE: Reading a file from a given URL
## Read data from URL and plot its graph
## URL here is from thinkspeak server.
## DATA FORMAT through URL is as follows:
#
# created_at entry_id field1
# 2018-01-04 17:00:54 UTC 1 21.52
# 2018-01-04 17:02:44 UTC 2 21.52
# 2018-01-04 17:03:05 UTC 3 21.82
## Run this code in Anaconda Jupyter (Python 3)
import pandas as pd
#model_data = pd.read_csv('https://thingspeak.com/channels/396517/field/1.csv?apikey=IWX3DY3PBB7E8WVX')
model_data = pd.read_csv('https://thingspeak.com/channels/396517/feed.csv?apikey=IWX3BV3PCQ7E8WUX')
print (type(model_data))
print (model_data)
Output In[1]:
        created_at   entry_id field1
0 2018-01-04 17:00:54 UTC  1  21.52
1 2018-01-04 17:02:44 UTC  2  21.52
2 2018-01-04 17:03:05 UTC  3  21.82
3 2018-01-04 17:03:24 UTC  4  21.82
4 2018-01-04 17:03:45 UTC  5  21.52
5 2018-01-04 17:04:06 UTC  6  21.52
6 2018-01-04 17:04:26 UTC  7  21.52
7 2018-01-04 17:04:46 UTC  8  21.82
8 2018-01-04 17:05:08 UTC  9  21.52
9 2018-01-04 17:05:27 UTC        10  21.52
10 2018-01-04 17:05:50 UTC        11  21.52
11 2018-01-04 17:06:06 UTC        12  21.82
12 2018-01-04 17:06:28 UTC        13  21.52
13 2018-01-04 17:06:49 UTC        14  21.52
14 2018-01-04 17:07:15 UTC        15  21.52
15 2018-01-04 17:07:48 UTC        16  21.52
16 2018-01-04 17:08:03 UTC        17  21.82
17 2018-01-04 17:08:21 UTC        18  21.52
18 2018-01-04 17:08:44 UTC        19  21.52
19 2018-01-04 17:09:04 UTC        20  21.52
20 2018-01-04 17:09:28 UTC        21  21.52
21 2018-01-04 17:09:46 UTC        22  21.52
22 2018-01-04 17:10:07 UTC        23  21.52
23 2018-01-04 17:10:22 UTC        24  21.82
24 2018-01-04 17:10:37 UTC        25  21.52
25 2018-01-04 17:11:01 UTC        26  21.52
26 2018-01-04 17:11:21 UTC        27  21.52
27 2018-01-04 17:11:39 UTC        28  21.52
28 2018-01-04 17:11:59 UTC        29  21.52
29 2018-01-04 17:12:21 UTC        30  21.52
30 2018-01-04 17:12:44 UTC        31  21.52
31 2018-01-04 17:13:05 UTC        32  21.52
32 2018-01-04 17:13:24 UTC        33  21.52
33 2018-01-04 17:13:40 UTC        34  21.52
34 2018-01-04 17:14:00 UTC        35  21.52
35 2018-01-04 17:14:22 UTC        36  21.52
36 2018-01-04 17:14:46 UTC        37  21.52
37 2018-01-04 17:15:04 UTC        38  21.52
38 2018-01-04 17:15:34 UTC        39  21.52
39 2018-01-04 17:15:49 UTC        40  21.52
40 2018-01-04 17:16:13 UTC        41  21.52
41 2018-01-04 17:16:33 UTC        42  21.52
42 2018-01-04 17:16:52 UTC        43  21.52
43 2018-01-04 17:17:11 UTC        44  21.52
44 2018-01-04 17:17:32 UTC        45  21.82
Code In[2]:# In[2]:
model_data.tail()
Output In[2]:created_at entry_id field1
40 2018-01-04 17:16:13 UTC 41 21.52
41 2018-01-04 17:16:33 UTC 42 21.52
42 2018-01-04 17:16:52 UTC 43 21.52
43 2018-01-04 17:17:11 UTC 44 21.52
44 2018-01-04 17:17:32 UTC 45 21.82
Code In[3]:# In[3]:
model_data.shape
Output In[3]:(45, 3)
Code In[4]:# In[4]:
model_data.describe()
Output In[4]:entry_id field1
count 45.000000 45.000000
mean 23.000000 21.566667
std 13.133926 0.109959
min 1.000000 21.520000
25% 12.000000 21.520000
50% 23.000000 21.520000
75% 34.000000 21.520000
max 45.000000 21.820000
Code In[5]:# In[5]:
model_data['field1'].describe()
Output In[5]:count 45.000000
mean 21.566667
std 0.109959
min 21.520000
25% 21.520000
50% 21.520000
75% 21.520000
max 21.820000
Name: field1, dtype: float64
Code In[6]:# In[6]:
model_data.columns.values
Output In[6]:array(['created_at', 'entry_id', 'field1'], dtype=object)
Code In[7]:# In[7]:
model_data.dtypes
Output In[7]: created_at object
entry_id int64
field1 float64
dtype: object
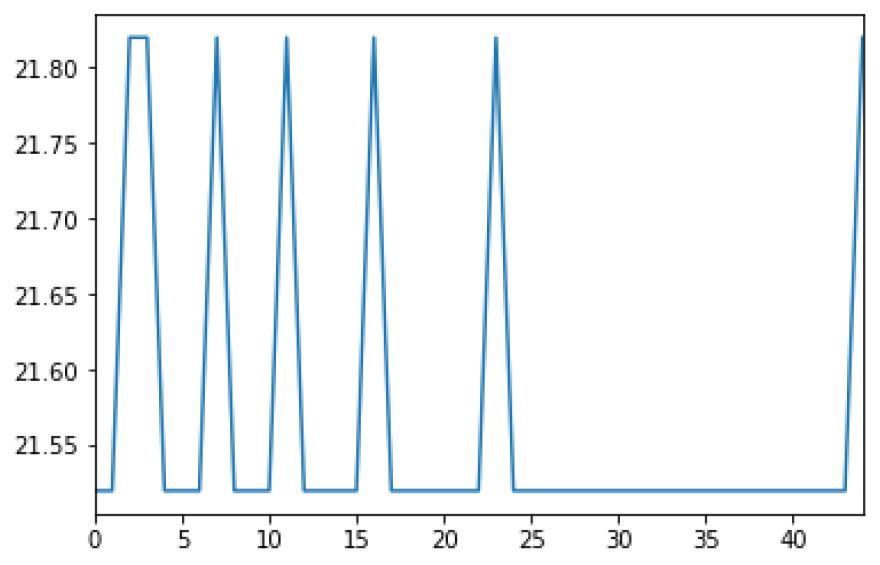
Code In[8]:# In[8]:
import matplotlib.pyplot as plt
model_data["field1"].plot()
plt.show()
Output In[8]:--------------------------------------------------------------------------------
Click here to see more codes for Raspberry Pi 3 and similar Family. &
Click here to see more codes for NodeMCU ESP8266 and similar Family.
&
Click here to see more codes for Arduino Mega (ATMega 2560) and similar Family.
Feel free to ask doubts in the comment section. I will try my best to solve it.
If you find this helpful by any mean like, comment and share the post.
This is the simplest way to encourage me to keep doing such work.
Thanks and Regards,
-Akshay P. Daga