
▸ Principal Component Analysis :

Recommended Machine Learning Courses:
- Coursera: Machine Learning
- Coursera: Deep Learning Specialization
- Coursera: Machine Learning with Python
- Coursera: Advanced Machine Learning Specialization
- Udemy: Machine Learning
- LinkedIn: Machine Learning
- Eduonix: Machine Learning
- edX: Machine Learning
- Fast.ai: Introduction to Machine Learning for Coders
- Consider the following 2D dataset:

Which of the following figures correspond to possible values that PCA may return for(the first eigen vector / first principal component)? Check all that apply (you may have to check more than one figure).
- Figure 1:
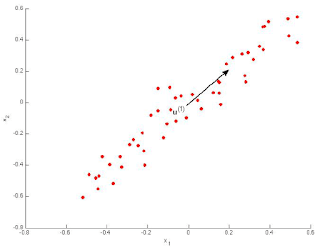
The maximal variance is along the y = x line, so this option is correct.
- Figure 2:

The maximal variance is along the y = x line, so the negative vector along that line is correct for the first principal component.
- Figure 3:

- Figure 4:

- Figure 1:
- Which of the following is a reasonable way to select the number of principal components k?
(Recall that n is the dimensionality of the input data and m is the number of input examples.)- Choose k to be the smallest value so that at least 99% of the variance is retained.
This is correct, as it maintains the structure of the data while maximally reducing its dimension.
- Choose k to be the smallest value so that at least 1% of the variance is retained.
- Choose k to be 99% of n (i.e., k = 0.99 ∗ n, rounded to the nearest integer).
- Choose the value of that minimizes the approximation error
- Choose k to be the largest value so that at least 99% of the variance is retained
- Use the elbow method.
- Choose k to be 99% of m (i.e., k = 0.99 ∗ m, rounded to the nearest integer).
- Choose k to be the smallest value so that at least 99% of the variance is retained.
- Suppose someone tells you that they ran PCA in such a way that “95% of the variance was retained.” What is an equivalent statement to this?
-
-
-
This is the correct formula.
-
-
-
-
-
-
- Which of the following statements are true? Check all that apply.
- Given only
and
, there is no way to reconstruct any reasonable approximation to
.
- Even if all the input features are on very similar scales, we should still perform mean normalization (so that each feature has zero mean) before running PCA.
If you do not perform mean normalization, PCA will rotate the data in a possibly undesired way.
- Given input data
, it makes sense to run PCA only with values of k that satisfy
. (In particular, running it with
is possible but not helpful, and
does not make sense.)
The reasoning given is correct: with
- PCA is susceptible to local optima; trying multiple random initializations may help.
- PCA can be used only to reduce the dimensionality of data by 1 (such as 3D to 2D, or 2D to 1D).
- Given an input
.
PCA compresses it to a lower dimensional vector by projecting it onto the learned principal components.
- If the input features are on very different scales, it is a good idea to perform feature scaling before applying PCA.
Feature scaling prevents one feature dimension from becoming a strongvprincipal component only because of the large magnitude of the featurevvalues (as opposed to large variance on that dimension).
- Feature scaling is not useful for PCA, since the eigenvector calculation (such as using Octave’s svd(Sigma) routine) takes care of this automatically.
- Given only
Check-out our free tutorials on IOT (Internet of Things):
- Which of the following are recommended applications of PCA? Select all that apply.
- To get more features to feed into a learning algorithm.
- Data compression: Reduce the dimension of your data, so that it takes up less memory / disk space.
If memory or disk space is limited, PCA allows you to save space in exchange for losing a little of the data’s information. This can be a reasonable tradeoff.
- Preventing overfitting: Reduce the number of features (in a supervised learning problem), so that there are fewer parameters to learn.
- Data visualization: Reduce data to 2D (or 3D) so that it can be plotted.
This is a good use of PCA, as it can give you intuition about your data that would otherwise be impossible to see.
- Data compression: Reduce the dimension of your input data
If your learning algorithm is too slow because of the input dimension is too high, then using PCA to speed it up is a reasonable choice.
- As a replacement for (or alternative to) linear regression: For most learning applications, PCA and linear regression give sustantially similar results.
- Data visualization: To take 2D data, and find a different way of plotting it in 2D (using k=2)
Click here to see solutions for all Machine Learning Coursera Assignments.
&
Click here to see more codes for Raspberry Pi 3 and similar Family.
&
Click here to see more codes for NodeMCU ESP8266 and similar Family.
&
Click here to see more codes for Arduino Mega (ATMega 2560) and similar Family.
Feel free to ask doubts in the comment section. I will try my best to answer it.
If you find this helpful by any mean like, comment and share the post.
This is the simplest way to encourage me to keep doing such work.
&
Click here to see more codes for Raspberry Pi 3 and similar Family.
&
Click here to see more codes for NodeMCU ESP8266 and similar Family.
&
Click here to see more codes for Arduino Mega (ATMega 2560) and similar Family.
Feel free to ask doubts in the comment section. I will try my best to answer it.
If you find this helpful by any mean like, comment and share the post.
This is the simplest way to encourage me to keep doing such work.
Thanks & Regards,
- APDaga DumpBox
- APDaga DumpBox